Strategy and objectives
15 de February, 2021Team structure
24 de February, 2021By now you should have realized how much I like metrics. In my first book, Startup Guide: how startups and established companies can create profitable digital products, I dedicated 6 entire chapters in addition to talking about metrics in the other chapters. In my second book, Product management: how to increase the chances of success of your digital product, there are 5 chapters dedicated to the theme of metrics, in addition to this theme appearing in other parts of the book again. It is no different here, the last two chapters talked a lot about metrics and I have also spoken in some other chapters about OKRs, objectives, data, and results.
Metrics are fundamental tools for any head of a product development team. Without metrics it is impossible to know if the team is progressing, evolving and fulfilling its mission. However, it is very easy to get lost in huge amounts of metrics.
In this chapter I want to share a little bit about how I usually work with metrics.
Metric types
I classify metrics into 3 major groups:
Internal metrics
These are the metrics that show how the product development team is at the moment and has evolved. The previous two chapters showed the metrics of productivity and quality. These are metrics that help the head of product and the team to understand how the work process is doing and where they should focus the energy to improve on these metrics. How can we increase productivity? How do we decrease the number of bugs? How do we guarantee the best product performance for our users?
Still within the theme of internal metrics, there are others that are more “soft” but also very important for you to understand the health of your product development team. They are metrics that help you understand if people are happy working in this team, if they are aligned with the culture and purpose of the team and the company.
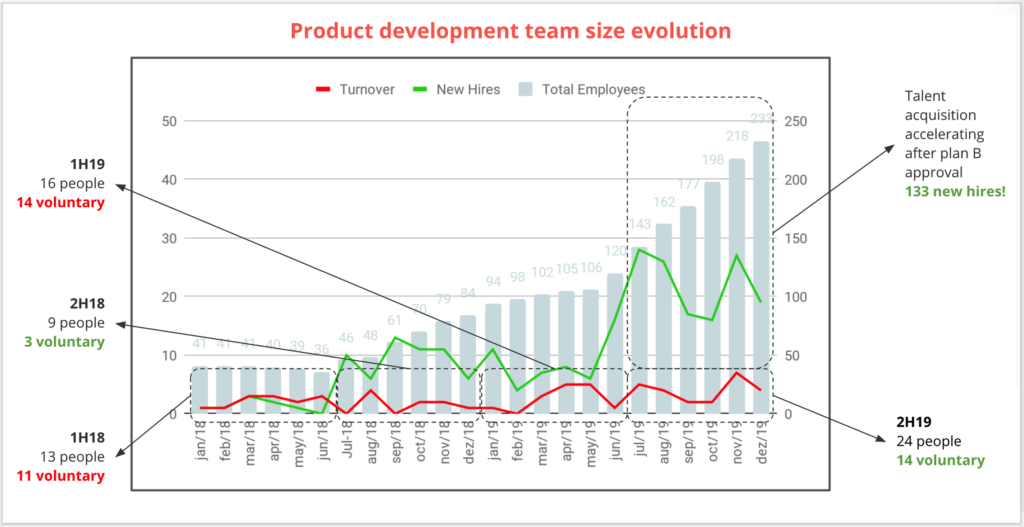
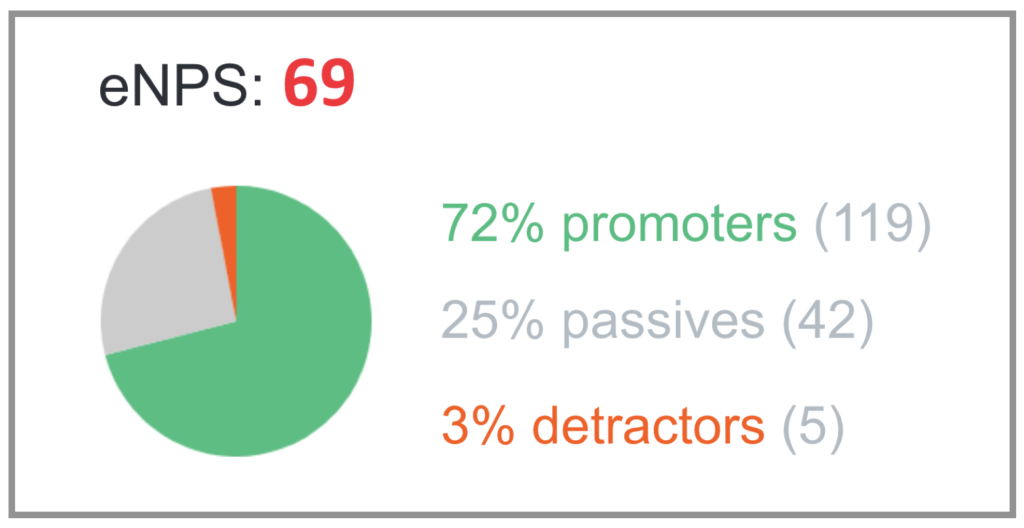
A very simple metric to follow is the entry, exit and average time of the people of the team each month. If more people leave than enter, there may be a problem with the team. If people stay a few months and then leave, it is another point of attention. You can also run an NPS survey (Net Promoter Score) with team members periodically to understand whether they would recommend working on your team for others and why they answered this way.
The following are two examples from Gympass. The first is the evolution of the total number of people on the team month by month, with total new and total people who left, also showing how many of those left voluntarily, that is, asked to leave. The second is the eNPS (employee NPS), which shows whether people were willing to refer the Gympass product development team to their friends to join us.


User metrics
These are the metrics that show that your product is being used by users, that is, that it is fulfilling its objective. These are the metrics of engagement and user satisfaction with the product. What is your user’s ideal engagement with the product?
At Conta Azul we wanted the product to be the first window he opened in his browser in the morning and the last he closed at night. We tracked the number of invoices issued per user per week, per month, and the amount of the invoices. At Gympass, we monitored how many users went to the gym per month, how often they visited gyms, and so on. At Lopes, we are monitoring the use of the new CRM by brokers. We want them to use it at least 4 times a week and that’s the number we’re tracking.
Another user metric that can be useful is satisfaction metrics. This metric tends to be a little more subjective, in addition to being laborious to measure. You should send a mini-survey to a portion of your customers every day. Therefore, before measuring and monitoring it, I recommend closely monitoring the engagement with the product. If the user is engaged, using the product at the expected frequency, there is a good chance that he will be minimally satisfied.
Business metrics
These are the metrics that show the product development team is actually delivering value to the business owner. What was the goal that the business owner had for the product? Increase sales, decrease costs? These goals vary with the type of company where the digital product is located. Is it a digital company, a traditional company, or a traditional born-digital company?
At Conta Azul, as the product sold was the digital product, user metrics and business metrics mix a lot. The number of users that use several times a week are those that will certainly continue to pay the monthly subscription and, consequently, will continue to generate revenue.
At Gympass, a traditional company born-digital, and at Lopes, a traditional company, revenue exists without the need for a digital product. So, what can the digital product do to increase revenue or decrease costs? At Gympass, at the same time that we wanted to reduce operating costs by automating most manual tasks, we also used the product as a revenue enhancer, helping the HR of our customers and their employees to understand and, consequently, become subscribers to the service. At Lopes, the main focus is on increasing sales, but we also have a focus on how to lower operating costs.
A very important point to monitor every month is the comparison between the value delivered by the digital product – revenue increase and cost reduction – and the cost of product development. What is expected is that the value delivered will be greater than the development cost. And managing this is the role of the head of product.
Tracking metrics
Metrics can be tracked daily, weekly, monthly, quarterly and yearly. Of course, the longer the update period, the more difficult it is to understand the metric’s behavior and make decisions about how to impact it. I prefer metrics that we can monitor daily and weekly. With weekly metrics, in a quarter we have 13 opportunities to evaluate a metric, understand how we can work on it and remove any impediments that are hindering us in reaching any objective linked to it. And the daily metrics give the pulse of the business. How many new users per day? How many users canceled?
At Locaweb, we always followed these numbers daily and, if something was out of the expected, positively or negatively, we tried to understand what had happened that had impacted the number. When we did something with the intention of changing these numbers, such as a new marketing or retention campaign, we could monitor these results daily. It is even possible to measure even more frequently in the case of products with large scale, such as Google Search.
On the other hand, there are metrics that are less frequent, such as the example above that I gave of new people joining or leaving a product development team. Even with monthly metrics or less frequent ones, I recommend monitoring the partial of this metric at least weekly. If you only follow up monthly, in a quarter you will have only 2 opportunities to assess progress and correct the course.
Summing up
- The metrics of a product development team can be classified into 3 major categories: internal, user, and business metrics.
- Internal metrics show how is the health of the team. User metrics show the relationship of the user with the product. Business metrics are those that show whether the product is, in fact, delivering value to the business.
- Metrics should be monitored as often as possible, at least weekly. Even if it is a monthly metric, try to follow the weekly or even daily partials of this metric, so you can have more opportunities to act earlier when there is a course variation.
In the next chapter, we’ll look at how to manage relationships with different areas.
Digital Product Management Books
Do you work with digital products? Do you want to know more about how to manage a digital product to increase its chances of success, solve its user’s problems and achieve the company objectives? Check out my Digital Product Management bundle with my 3 books where I share what I learned during my almost 30 years of experience in creating and managing digital products:
- Startup Guide: How startups and established companies can create profitable digital products
- Product Management: How to increase the chances of success of your digital product
- Leading Product Development: The art and science of managing product teams

